Summary Tables - the how and the why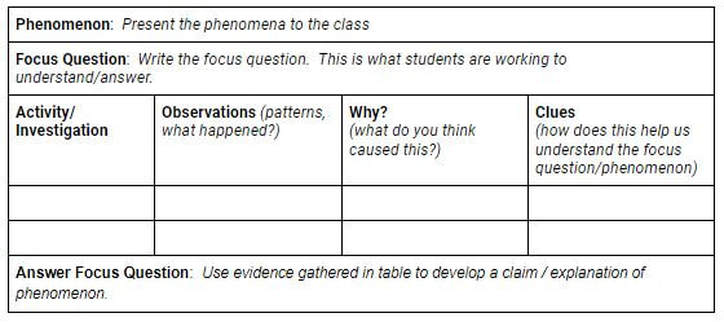 Example Summary Table set up In science it is important that ideas/conclusions be able to change over time as new evidence is found. As in real science, our science classroom needs to allow for thinking to change/be revised as students collect new data. One of the best ways that teachers can assist students in organizing their thinking is by making use of a summary table or KLEWS Chart- a way to record activities and ideas.
A summary table can be easily adapted to meet the needs of your classroom. For example column headings can be tweaked to best fit the CCC for the instructional cycle. Other adaptations could include a column for evidence, noticings, questions, etc. Below are examples of some of the possibilities: See above for Summary Table example See below for KLEWS Chart example 4. Tips and Tricks:
There will be at least one summary table or KLEWS chart in each unit. 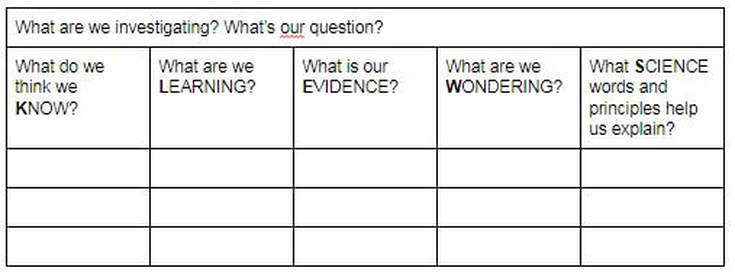 KLEWS Chart set up
0 Comments
Leave a Reply. |
AuthorPhenomenal Science Leadership Team Archives
February 2022
|
 RSS Feed
